So, now that you’re familiar with index investing through index funds and ETFs, it’s about time to learn about the underlying “asset” – The Economy.
Before talking about how and why the markets move, why investors are confident (“bullish”) for the long-run, and the cyclical nature of the economy, I’d like to define a few terms.
Bull market
A bull market is a condition of a market whose value rises and is expected to rise. Basically, it characterizes a market that has a positive sentiment around it – the economy performs well and investors are confident and optimistic.
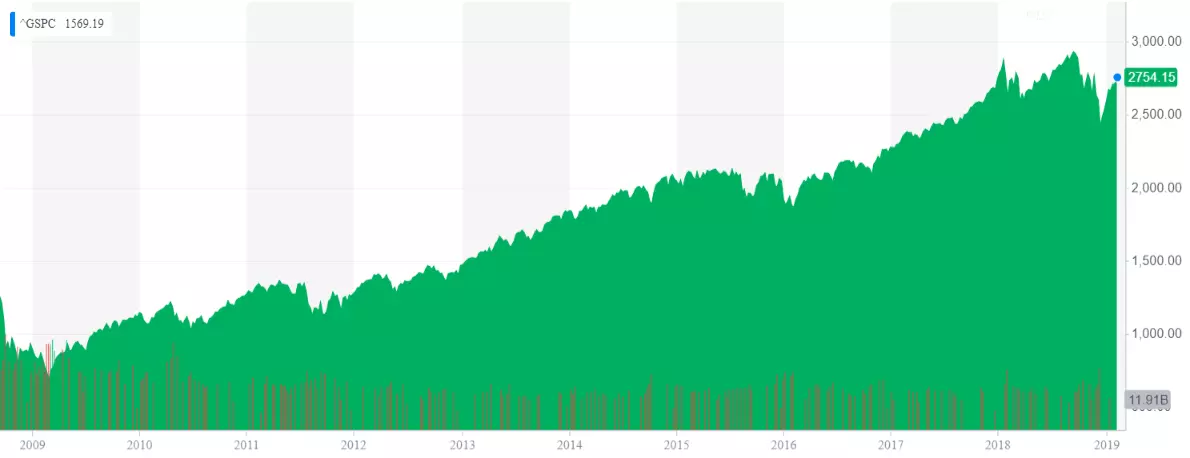
Bull markets can last for months and years. If you take a look at the 10 year history of the US stock market, you’ll have no problem recognizing that it was a bull market. Just to mention, there is no specific measure regarding when exactly a bull market starts, but it’s commonly accepted that the start is characterized by a 20% rise after a 20% fall in value.
And bull markets are not only related to stocks. Any market which value increases over time is considered a bull market. One example would be the cryptocurrency market in 2017, when the price of Bitcoin piked at ~$19k (while starting the year at around 900$).
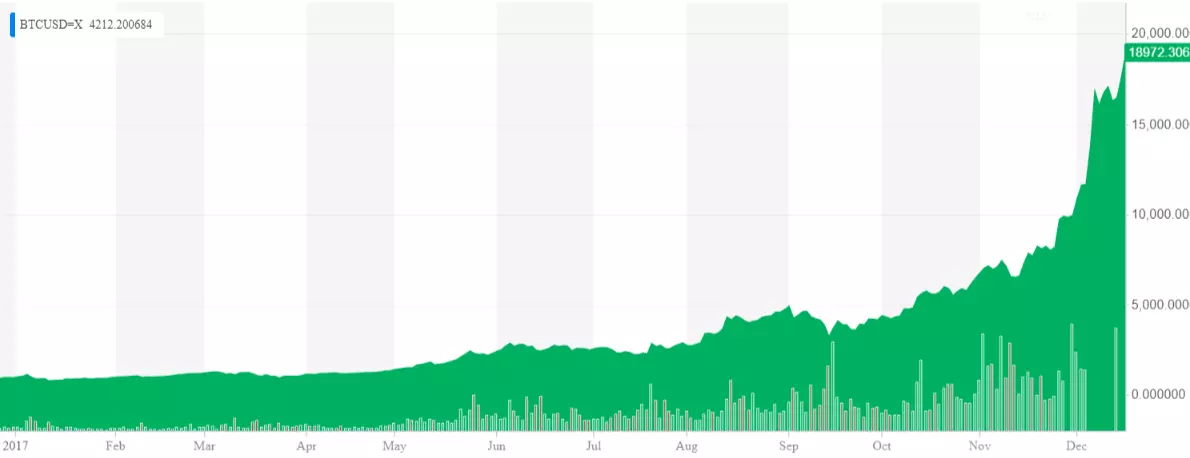
You can’t see it in the picture, but what happens after an unsustainable growth is a market crash.
Market crash
A market crash is a sudden, not insignificant, and usually (but not always) unexpected drop in the market value. I’ve touched this topic in the Stocks & Bonds post from this series:
If stocks become overpriced (pumped by investors who don’t understand how the business works), this may lead to a devastating crash and leave you with less than half of your investments. This is called a bubble and it forms when something is valued more than it actually is.
Okay, it made sense to put the blame on the investors in that post, but it’s not just them… Or us. Market crashes can be created or intensified by unsustainable economic systems, catastrophic events, and even the general public. A major contributor to any market crash is the speculative bubble formed around the asset class. That means that the price of a certain asset is pumped by speculation rather than its value. However, a market can’t be declared as a bubble unless it pops – and that’s where the big, sudden, and unexpected movement begins.
What follows after the initial drop is the biggest contributor to most market crashes – panic. The general public reacts and pushes the prices even lower by avoiding the market, selling (low) to cut losses, and losing faith in the market. Back to the examples we used for bull markets, the S&P 500 and the price of Bitcoin, let’s see what happens once the prices become inflated.
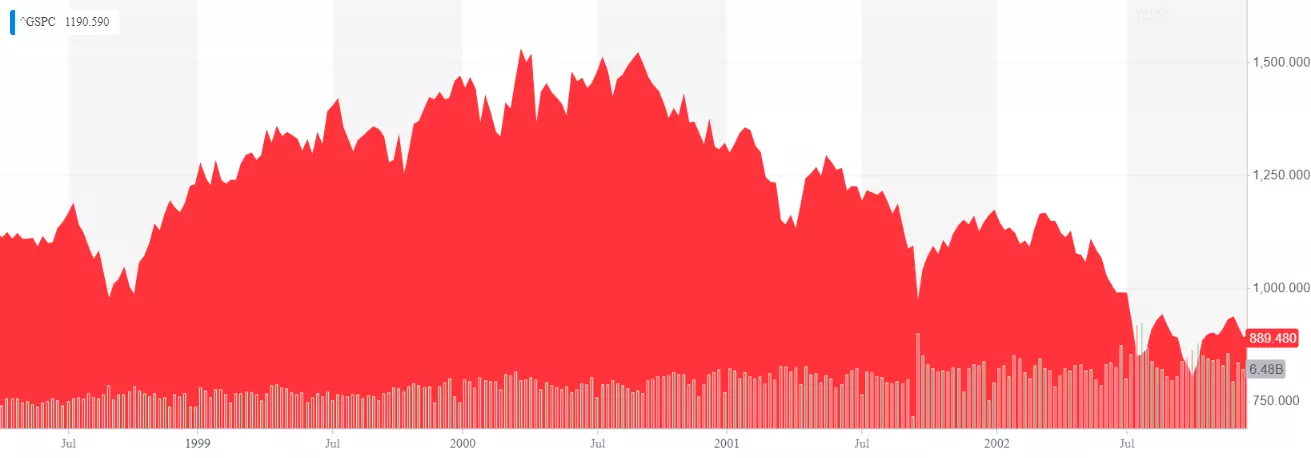
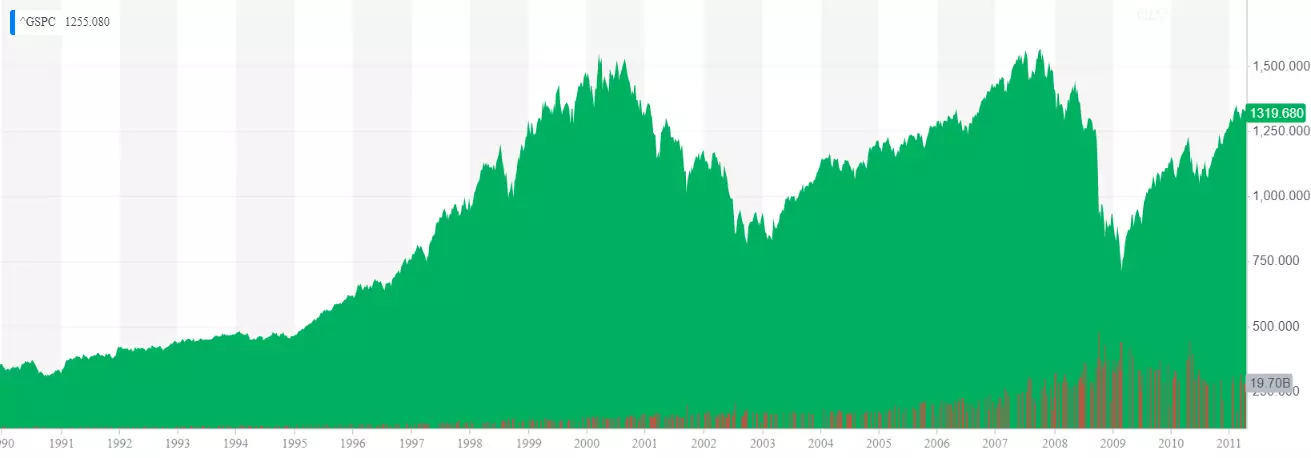
In early 2000, after a huge growth and adoption of the internet, overconfidence in the markets, and investors looking to profit off of the next big thing, the prices of the tech companies became unsustainably overvalued. And as with every case of unsustainable growth, this lead to a devastating crash with many companies going bankrupt or losing >80% of their market value. Here is a picture of the S&P 500 during the dot-com crash.
But you learned about market indices and you know that S&P 500 is an indicator for the performance of the US large-cap stock market. Take a look at what happened to the tech sector through a picture of Nasdaq 100 during that time.
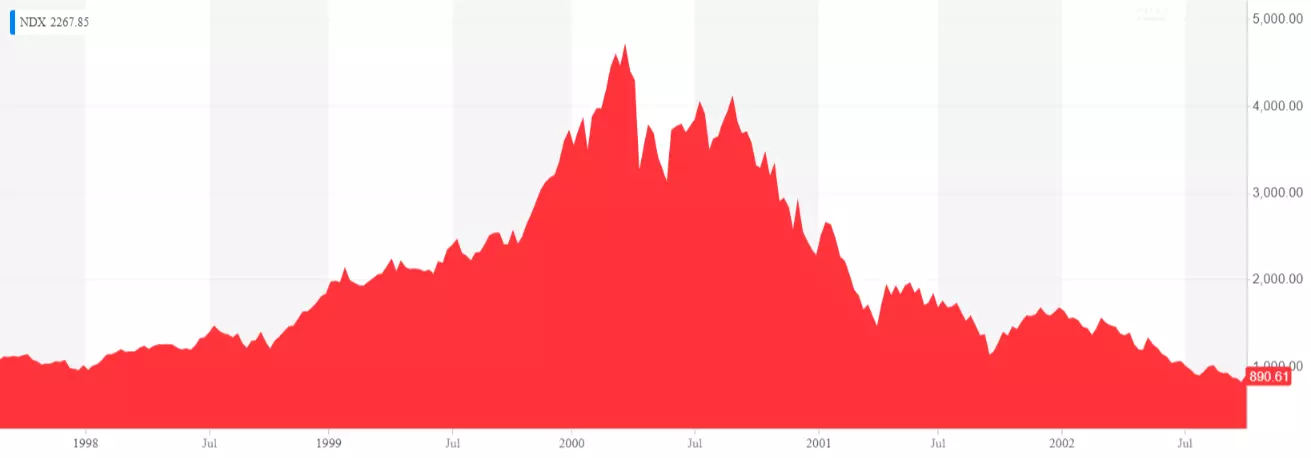
Looks more severe, doesn’t it? As the S&P lost ~50% of its value, NDX went from ~4600 high to ~800 low, losing more than 80% of its value. It needed ~15 years to recover to the highs before the burst. If you want to know details about the dot-com bubble, you can read more about it here.
Looking at different charts, here is the chart of the price of Bitcoin after the bull rally.
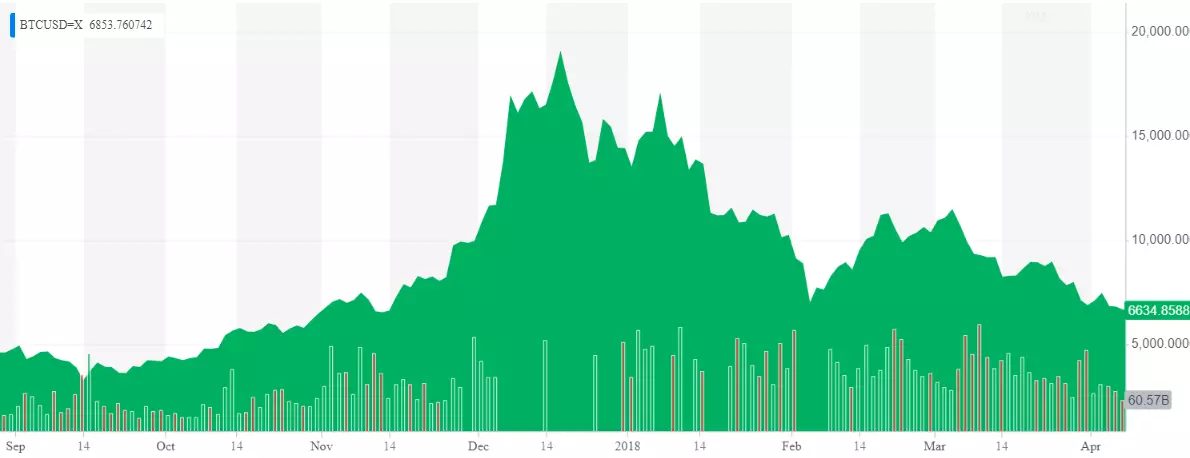
After reaching its high, the price of BTC crashed to $13k, $11k, $6k, and continued going downhill for the following year, losing more than 70% of its historical highs. And the symptoms were similar, namely, an asset becoming overvalued and investors looking to profit off of the next big thing.
Another stock-market crash happened in 2008, when the environment of low interest rates and extremely light lending requirements inspired home-ownership, thus making the house prices soar, which made investors want to profit off of the rising prices, which made real estate a speculative investment, and… You get the point. Here is the impact the housing bubble had on the US stock market:
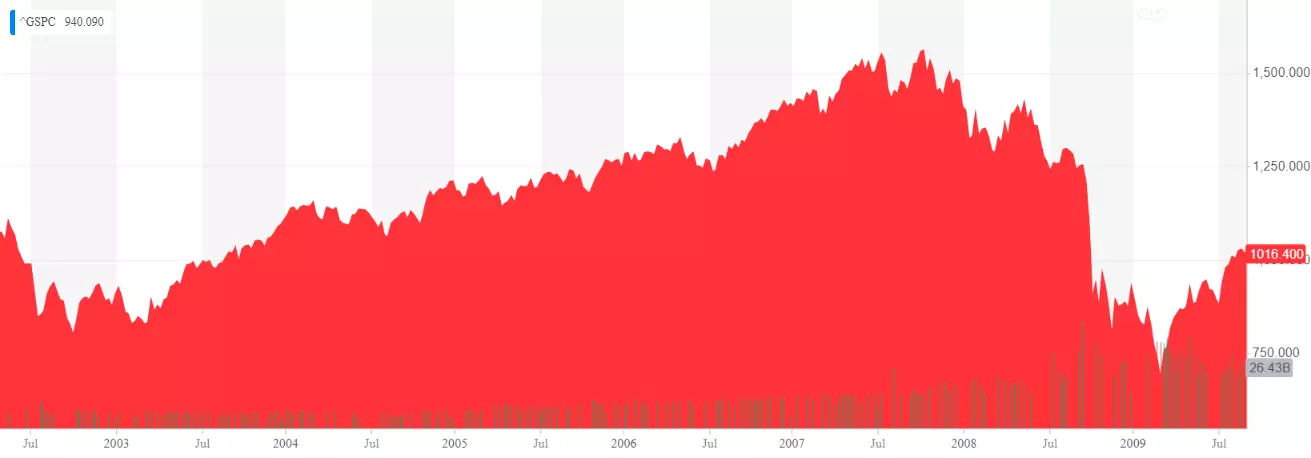
From 1561 high to 683 low. In the market cycles section we will see how entangled the economy is and how a housing crisis can affect the stock market to this extent. By the way, I really enjoy describing the details behind these crashes, but for the context of the Become an Investor series it’s more important to get the main take-away:
Putting all the specific factors aside, all the crashes share two main characteristics: inflated prices and panic.
You can find a list of various market crashes that happened through history here. It’s a really interesting topic to read about, so I’d highly encourage all my readers to learn more about them.
Now, although a crash happens suddenly, we can see that the respective market keeps plummeting after a crash. We call that a bear market.
Bear market
A bear market is a condition of a market whose value fell from recent highs, is falling, and is expected to keep falling (or not rising). Key characteristics, opposed to those in bull markets, are: pessimism, fear, and negative investor sentiment.
Unlike a market crash, a bear market is not a sudden event, and a market is characterized as bearish once its value falls for ~20% and doesn’t recover for two or more months.
During the financial crisis after the housing bubble, there was a bear market lasting 17 months before the market started recovering. During the time, the S&P 500 lost more than 50% of its value, as illustrated in the picture below.
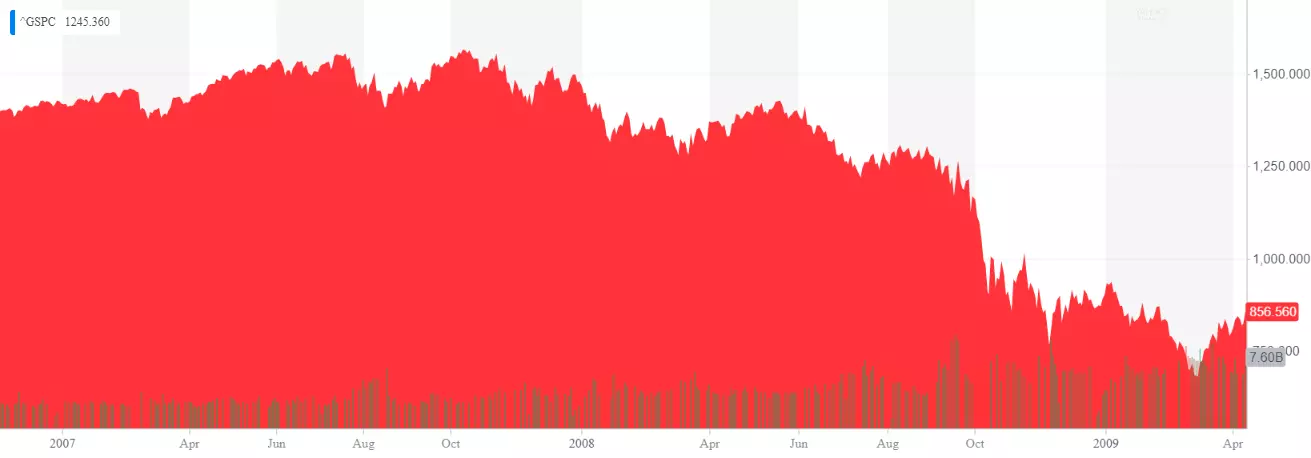
Bear markets usually follow after a market crash, but not necessarily. A slowing economy can also bring a bear market. This can mean different and not necessarily mutually exclusive things, such as: low productivity, high inflation, high unemployment, low salaries and thus purchasing power, a change in the interest rates, a change in the tax rates, a switch in investors’ sentiment, etc.
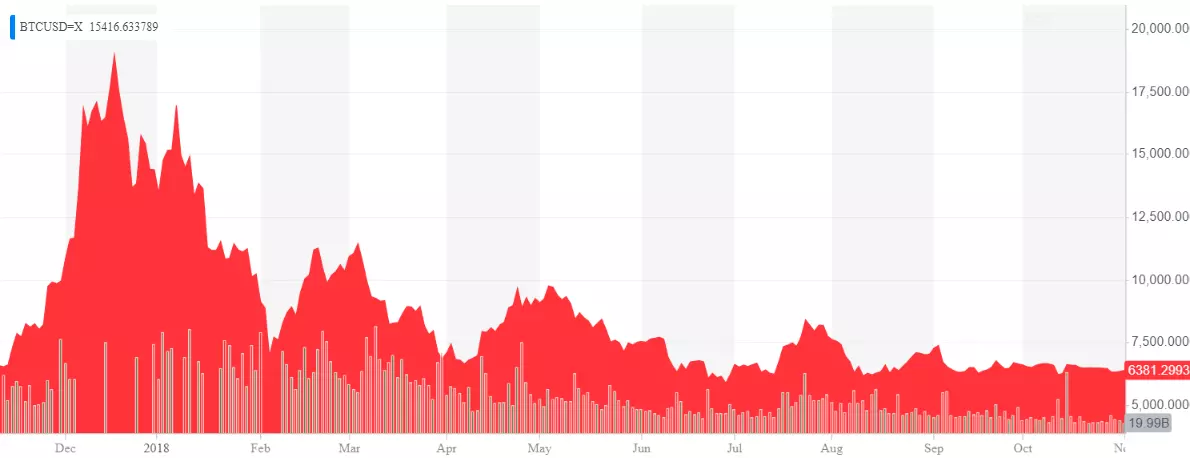
Because we showed the bull run and the crash, I think it’s good to show the 2018 Crypto bear market as well.
Correction
There is another term related to worsening of the market conditions, but it’s too small to be called a crash and it’s too short to be called a bear market. It’s called a correction – a decline in prices that has a duration of fewer than two months. A correction in the stock market happened last year (2018) between January and March.
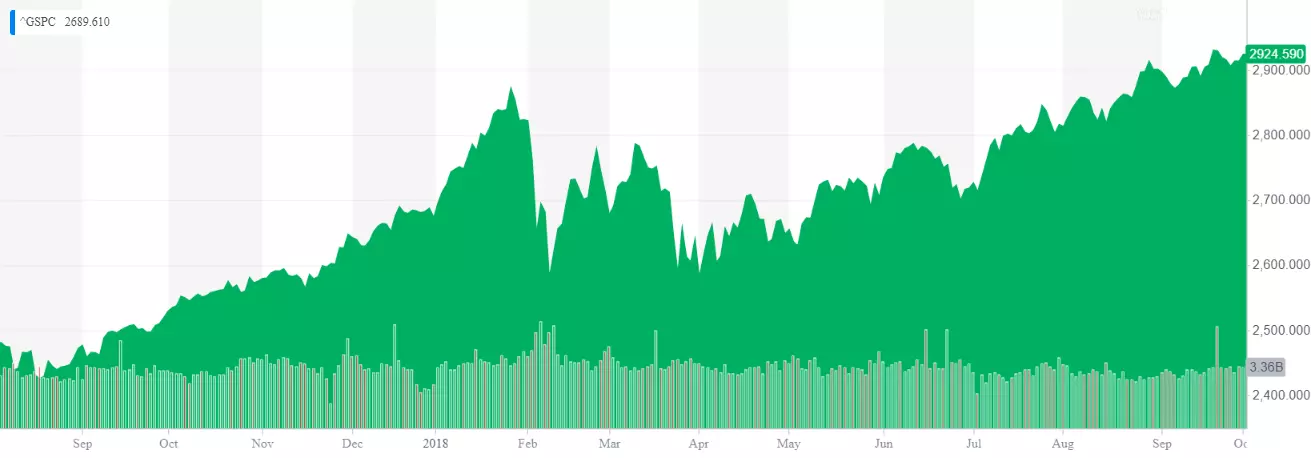
Unlike a bear-market, a correction is a nice place to enter the market or buy some discounted stocks. However, look at the current state of the markets since September 2018. It’s already two months below its previous highs. Can you tell whether it’s a correction or a bear market? Would you bet on it?
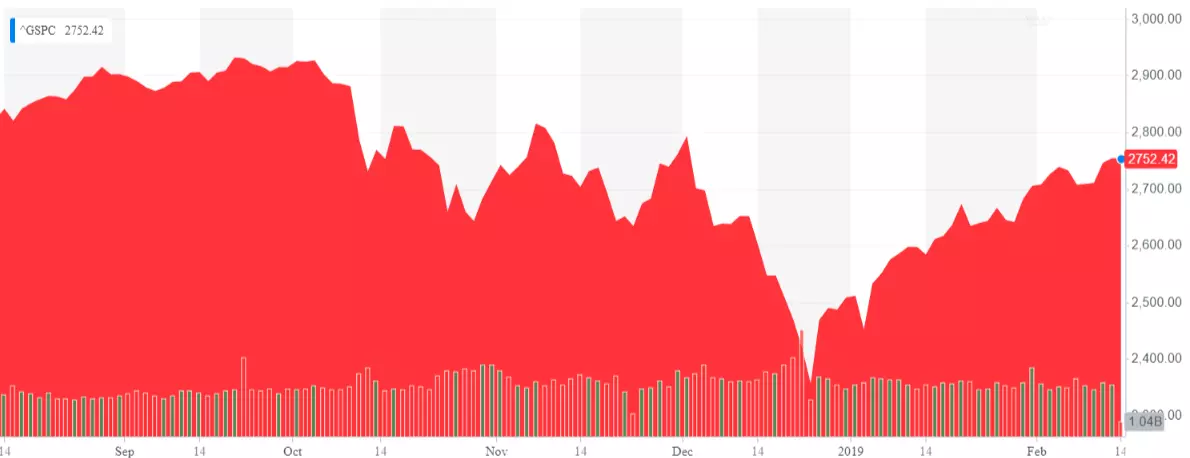
However, I’m following an investment strategy that lets me sleep well at night while remaining in the market. This post will give insights into why is that so, but the next two posts will explain it further, by covering asset allocation and investment strategies. Make sure to subscribe below and follow MonkWealth on Facebook and Twitter, so you’ll get updated each time a new post is published.
Recession
A recession is a period in which there is a general economic decline for two quarters or more. Although market crashes and bear markets may (and may not) lead to a recession, a recession is not only affecting people that are “in the market”, but also the general population. It’s felt into all parts of the society through significant drops in income, employment, demand, productivity, production, etc.
At the time of writing this post, the last recession was the “Great Recession” following the housing bubble.
I won’t go into many details about it, but will point out that a recession is really not a good time to live in. Think about it, the increase in unemployment makes consumer demand decrease. A decrease in sales make businesses lose money. Businesses not making profits means more unemployment and defaults. So there is less industrial production, less jobs, and thus people can’t afford their mortgage payments and even lose their homes. Banks also lose money, because people default on their mortgage payments, so they also need to cut costs (more unemployment). It’s all a big interrelated self-incentivized circle that makes the whole economy collapse. It’s not good.
Historically, recessions last for 6-18 months. I’m sure that many people new to these topics may wonder how does this end. Before going into it, I’ll just mention that it can get even worse. A recession can become a depression if it lasts for years. Although the US had tens of recessions since 1900, it only had one depression, starting in 1929 and lasting 3 years and 7 months. As I encouraged you to read more on market crashes, I’d also encourage the interested to read more about the recessions by clicking here.
Here is a logarithmic chart that will help you visualize the recessions and the cyclical nature of the economy. The grey lines represent recessions.
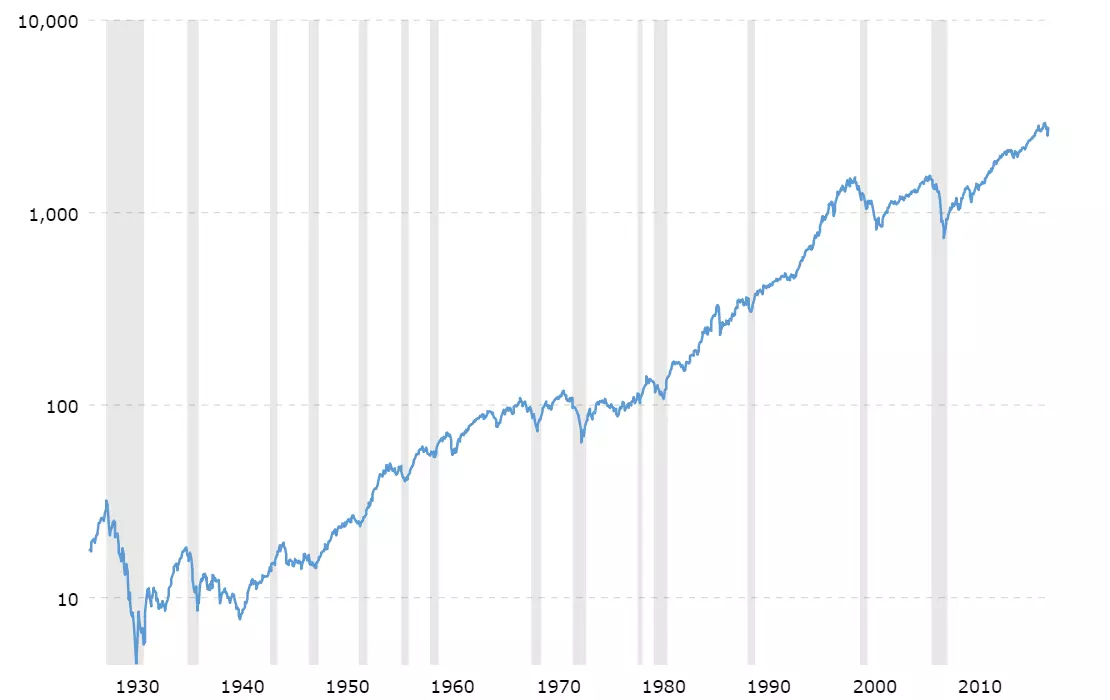
While we’re at it, as counter-intuitive as it sounds, recessions also arise as a sole result of the economy’s cyclical nature. Let’s dive more into it.
Market Cycles and the Economy
Okay, we saw what bullish and bearish outlooks mean in terms of investing, but what about the general population?
Let’s oversimplify this…
During a bull market things are going well. The companies produce, the people spend and consume, and the prices and salaries rise at a healthy inflation rate. Overall, it’s going well. But how does this happen?
Basically, it boils down to spending. A person that has a job earns an income. Based on this income (and other factors, but don’t forget that we’re oversimplifying), the banks consider him creditworthy and thus he can borrow money to increase his spending. When a buyer spends more, whether on assets or consumer goods, the seller earns more.
That’s good for the seller’s business, so the company makes profit and increases its value. That incentivizes the company to produce more to increase profits, so they hire more people. These people start earning and based on that the bank consider them creditworthy. Did this became repetitive? Cycles, right? Not yet.
As people can afford to spend more, the prices of consumer goods and assets also rise (inflation – read more about it here). A little bit of inflation is good for the economy because it intencivizes production, supply, and demand, but too much can literally destroy a country. This happens when the prices of consumer goods and assets rise with a significantly faster pace than the salaries. When, or before, things get out of control, the central bank raises the interest rates – which discourages borrowing and, automatically, discourages spending. With higher interest rates, less people borrow, while existing debts rise. This means that people now have less money to spend.
With less buyers, the sellers’ profits slowly decrease, so they need to cut spending as well. Companies lose value and this makes the employees receive lower salaries or even lose their jobs. This means that people can borrow less and thus spend less. Did this became repetitive as well? #cycles? Soon.
Because people need money, but there is no credit or jobs to support that, they start selling assets. The buyer will go to the lowest asking price, so the assets also lose value. In other words: stock prices fall, asset prices fall, people have less money, no jobs, default on their payments, and there are no loans to help out. In other words: the economic activity decreases and we enter a recession.
This is the period when the central bank and the government need to make changes in order to fix the situation. For example, interest rates are lowered to stimulate the economy (there are many other factors, but we won’t go into details – oversimplifying, remember?). As the economy recovers, incomes, borrowing, and spending all catch up and it’s a beginning to a new cycle.
This is a beautiful moment to get in the market. Too bad we can’t exactly predict any of this. These cycles last for 5-10 years.
Once again, this was an oversimplification. If you’re feeling like learning more details about How the Economic Machine Works, watch the video.
Why is this important?
Okay, let’s move to the main point of this post!
Why do I explain how the economy works in a Become an Investor series?
First of all, you need to know the basics of what you actually invest in. And believe me, we hardly scratched the surface here. But it’s not the main reason.
The main reason is for you to see that regardless of all the corrections, market crashes, bear markets, and recessions, we’re still fine. And “fine” is a major understatement. Just look at the performance of the stock market only in the last decade. And not only that, but following any recession, it started recovering within 2 years and always continued towards the ultimate direction of the economy – upwards. Let’s zoom in a little bit.
Here is a picture of the stock market between 1950 and 1970.
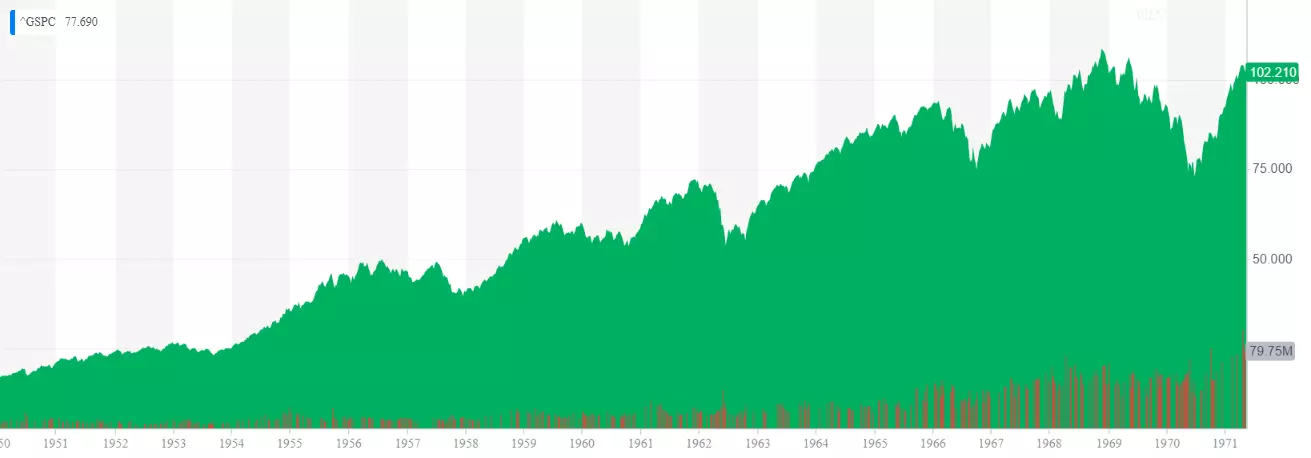
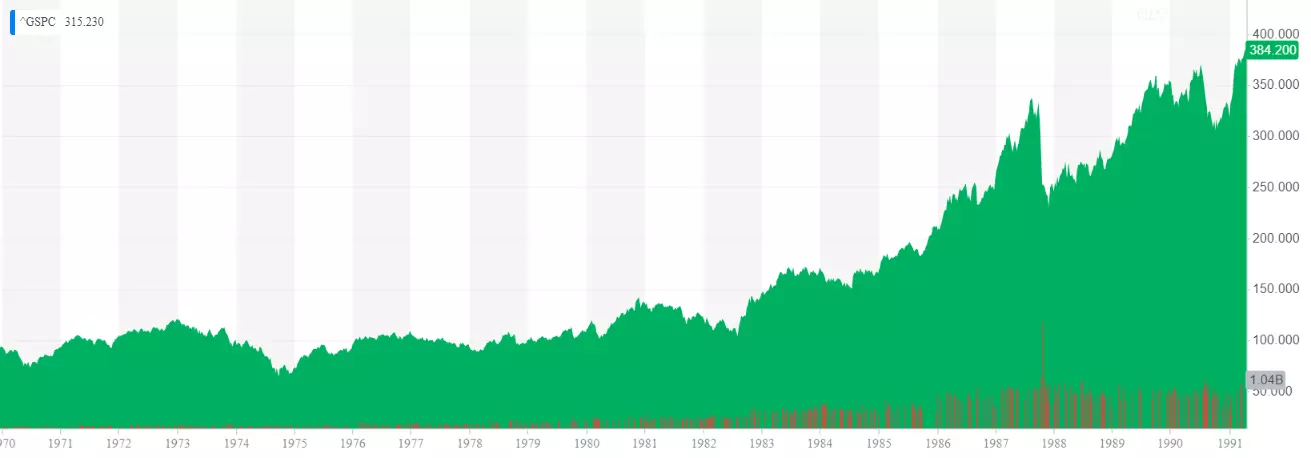
Here is another picture from the stock market, but this time from 1970 to 1990.
Here is another one from 1990 to 2010. There are the two crashes discussed above.
And lastly, here is its current state since 2010. We came a long way.

And remember that we showed a logarithmic scale of the full history of the S&P 500? Here is the chart in a linear scale.
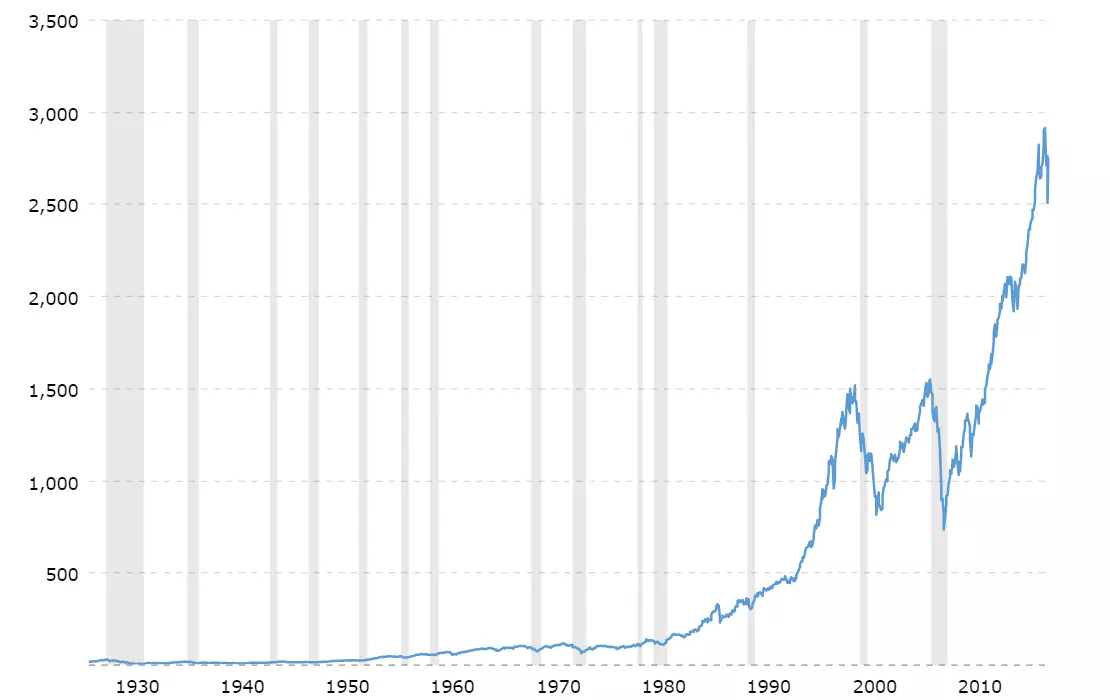
The market always go up.
I repeat: the market always go up.
If you’re in it for the long-run and won’t need the money that you invested in near future (by having an emergency fund), there is almost no risk of losing anything. Especially if you’re well diversified. For example, if you own ETFs that track the S&P 500 there is around 100% chance that you’ll be much much wealthier in 20 years. The only thing that can go wrong is America collapsing. I’ll withhold myself of explaining why that’s a highly unlikely scenario. You can track the MSCI World index if you are worried about black swans or checkout this post from Macro Affairs that gives ideas on handling such events beyond stocks.
But notice, the market indeed goes up over the decades. Not every year, month, week, or day. An investor interested in building long-term wealth should be aware and prepare to handle the short-term volatility. And by handle I mean keep his sanity when things go bad and not sell. The market will always recover.
People who were going in and out over the last decade may have lost money, while the market increased for more than 300%. How is that possible?
Well, they fell for the panic. They fell for the gold rushes. They bought the hype… But not the market.
Don’t beat it, don’t time it. Match it.
Invest in the economy itself through a diversified index as a representative sample. Ignore the short-term volatility and enjoy the long-term returns. Investing all the surplus you don’t need is the one and only surefire way of making your money work for you and building wealth. It’s really that simple.
But of course, it’s up to you. You are the only person responsible for earning the surplus, deciding to risk it, and staying on the course when it seems like the world is collapsing. And believe me, there will be no indicators that it’s not.
Afterword
Okay, we had to cover how the economy works and the ultimate direction of the stock market. Any of the diversified indices we discussed are a representation of the economy as a whole and I think that this post illustrates how entangled everything is.
Lastly, knowing that the market always recovers is an idea that can motivate you to stay in it when things are going good and prevent you of selling when things are going bad. That’s the secret behind building a lifelong wealth.
Simple and effective.
Join me in the next post, where we’ll continue where we left off and learn how to utilize the index funds and ETFs into a well diversified portfolio.
See you in part 7!
Previous Become an Investor post: ETFs
Next Become an Investor post: Asset Allocation


