Cash vs Stocks in 30 Years
Cash or stocks – hoard or invest?
This discussion comes up so often that I’d like to write a short post on it and reference it when needed. Unless you’re a subscriber and got this in your mail, you most probably ended up on this post by clicking on a link where I explain how assets outperform cash over the long-term.
Well, welcome!
Without further ado, let’s break down a case.
The Case
What we’re actually investigating is a person’s net-worth and how would it behave if it’s allocated in one of two different asset classes: cash and stocks.
For the purposes of this post, we’ll assume that the person has access to $10k, tax free, and he has no plans of spending them in near future. The goal is to see which strategy will help him maintain his wealth better and maybe even increase it in the process.
Cash performance in 30 years
So, let’s say you had $10k available 30 years ago. Keeping them in your bank account would mean that today you’d have $10k. Great job on not losing or spending them. Here’s a graph that can help us visualize the performance of your portfolio over the years:
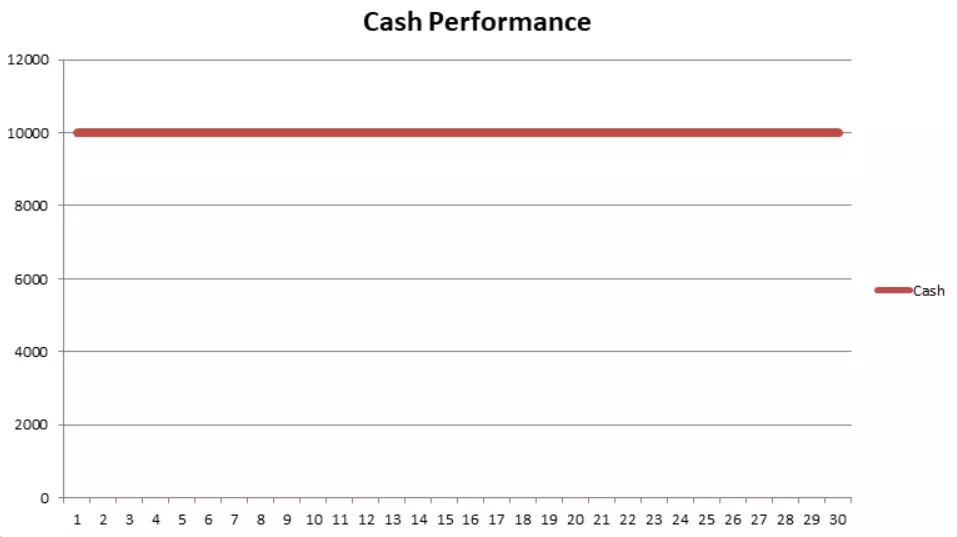
No surprises there.
However, the value of the piece of paper we call a bill is not absolute. It’s determined by what it can actually buy. And whatever meant $10k 30 years ago, doesn’t mean $10k today. In other words: the purchase power of $10k is much lower today than it was 30 years ago.
To put it into perspective by going a few decades back, an average house in the US costed around $17k in 1963. Yes, inflation is a thing and the post Inflation Explained is a highly recommended read if you want to know more about it.
As described there, in a healthy economy the inflation devalues the money at a rate of 2-3% per year. Taking the 2% as a less extreme example, here is the chart that represents a more precise value of the money saved.
Not cool. And the red line is not a coincidence.
But you don’t have to trust a guy producing simple charts in Excel. Go to any inflation calculator, enter the years of interests and see what actually happens with the value of the money.
I used The Inflation Calculator at westegg.com, and this is the result I got for a 30 year period:
What cost $10000 in 1988 would cost $21427.27 in 2018.
Also, if you were to buy exactly the same products in 2018 and 1988,
they would cost you $10000 and $4568.32 respectively.
Seems like I was actually optimistic with my Excel charts.
Long story short: keeping your wealth in cash will reduce your purchase power because of inflation. And don’t forget to couple it with opportunity cost – the cost associated with missed opportunities.
Now, okay, you can hedge against these losses by putting the cash in a savings account or a similar cash-alternative no-risk option. Thirty years ago it may have outperformed inflation, but the rates offered nowadays hardly yield any returns. Since there are countless variables to consider and they’re time bound, I’ll just assume that somehow you beat inflation and kept the original value of your money. So I’ll use $10k for the cash, although that amount can buy less than half of what it could 30 years ago.
What about stocks between 1988 and 2018?
Stock Market performance in 30 years
So, for this example we will use the S&P 500 index as a benchmark and will assume a lump-sum of $10k for 30 years. Also, the dividends will be reinvested, as the money is not needed, and we’ll also consider fees and taxes.
So, first thing’s first, here is the performance of the S&P 500 in the same period as we discussed the cash.
I used an export of the S&P 500 historical data from Yahoo Finance and used it to produce this chart. But on the chart we’re showing the value of the index itself – and we know that that’s just a relative number that can’t be converted to a currency. If you’re not that familiar with market indices, make sure to read about index investing, index funds, and ETFs.
Although ETFs were not an option back then, Vanguard introduced the first fund to track the S&P 500 in 1976, so individual investors had the option to invest in it.
Let’s see the actual performance of $10k if we were to dump them in the stock market in 1988.
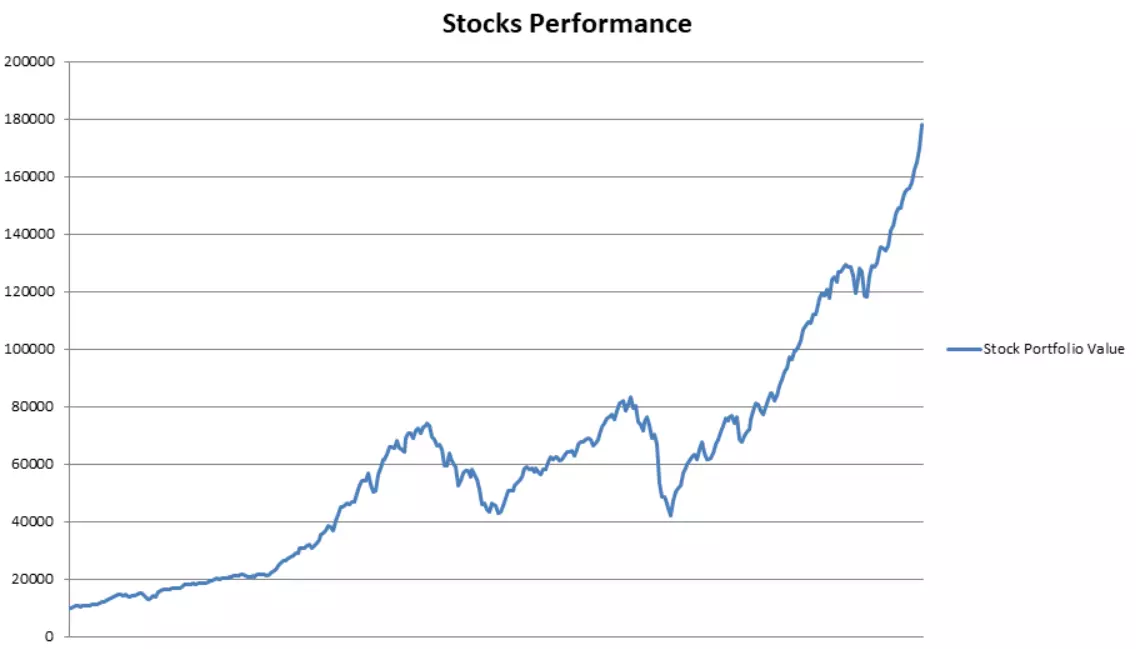
Boom, more than 10% annual returns with dividends reinvested (calculated using the DQYDJ S&P 500 Return Calculator). We can’t ignore compounding when discussing long-term investment decisions. Anyway, in regards to total returns, we’re looking at more than 2000% gains over the years.
But let’s play it fair and consider management fees, taxes, inflation etc. and we end up with the following result:
Your $10k would be worth $177k after 30 years.
There is no other vehicle for maintaining your wealth like the stock market – and a diversified index as its representative.
The last graph was created by downloading a CSV using the DQYDJ DCA Calculator with a lump-sum of $10k and 0$ in further ongoing contributions. And it includes dividends paid, dividend taxes, capital gains taxes, management fees, and inflation.
And I have to point out that this is a period with two severe recessions, the dot-com crash and the great recession, and holding your wealth in assets is still the clear winner. Let’s go to the unanimous decision and make it official.
Conclusion
Is a picture worth thousand words? I don’t know, but this post is almost a thousand words long already, and I think that this picture is a good summary of what we discussed:

And remember that we’re comparing an inflation adjusted portfolio vs a straight line that somehow beat inflation and kept its value over the years.
Stocks beat cash in the long-term.
But let’s make it even harder… What would happen if we entered the market right before a crash?
Lump-sum before a recession
Let’s use the two recessions actually – let’s say that you invested all your savings in the stock market in 2000, right before the dot-com crash and didn’t sell during the housing crash. There is no doubt that your stock portfolio will go down during these recessions, but let’s see the actual performance over the years.
So yes, cash actually outperformed the stock portfolio for quite some time… But is it something to worry about? If you need the money, sure, I’d even say don’t ever invest money you’re planning to spend in the next 5 years. But we assumed money we won’t need, so why would we care about short-term volatility? If someone is looking for quick profits, he should distinguish between trading and investing.
And most importantly, what happened over the years? The same thing that happens every time when we match the market – long-term returns overshadow any short-term losses.
We know that past performance doesn’t guarantee future results, but if we’re using quotes to build an investment strategy from, we also know that time in the market beats timing the market. And we also know that even with the worst possible timing, our $10k would be worth more than $25k while the performance of the cash is constant.
But is it? The stock portfolio is inflation adjusted. The value of $10k in cash from 1st of January 2000 is actually worth 6674$ on 1st of January 2018.
Afterword
There is no 30 year period in which cash outperforms the total stock market.
If anyone is worried of entering the market right before a recession, he should learn about Dollar Cost Averaging. If anyone is worried about having too high of an exposure to the stock market (or a specific part of it), he should learn about Asset Allocation. But most importantly, if anyone is worried about losing money, he should learn about Inflation.
Become an Investor and build long-term wealth the right way.
Good luck!








Comments: 10
This is a great informative post for someone like me who played it too safe for too long. I’m not afraid of investing anymore (ok, still a little scared), but I think it’s because I have a career now where there is suppose to be a pension at 55. This is one of the ways I am mitigating my risk. Judge me – I know (lol)!
Anyway, it’s wise to reflect on how the riskiest option may very well be leaving the money in cash.
Thanks Savvy History,
At the end, it boils down to living a lifestyle we enjoy. Capital gains and some calculated risks are a bonus.
Hi,
thoroughly written article, I liked it and featured it on FIREhub.eu
Thanks for writing.
Thanks Noemi, always a pleasure.
Hi Monk!
I love your analysis’, and you know I also like to challenge the perception of the stock market 😉
I think RIGHT now (looking at your own graphs from previous posts also), the question is not whether you should hoard cash for 30 years, or invest in the stock market – the question is, whether you should hoard cash for the next couple of years, until the next recession hits – and THEN invest in the stock (or something else)… 😉
So, should you?! 😛
Thanks Nick! Always good to hear from you.
That’s a good question. However, it’s also one I wouldn’t dare answering. 🙂
I’ll share what I do though. I don’t put all my surplus in the stock market and hoard a portion of it for a more adequate valuation. The reason I do that is because I’m not as sure that the recession will hit in the next couple of years. I also don’t want to miss out on potential gains of the next 5 years if the next global recession comes in half a decade.
And of course, I only invest money I won’t need.
Fully agree, that if the alternative to stocks is cash, always be in stocks 🙂
I personally want to have a bit more diversification to my portfolio than just stocks, since I would imagine the high appreciation needs to be resolved somehow – either by lower returns in the foreseeable future or by a correction, as we saw already in the beginning of the year.
So yeah, if the alternative is to have cash, you’d need to be a psychic to time it.
For me, the alternative is lots of things. Most interesting one a camel 🐪 (only 0.3% of my wealth in her though). Some real estate, some peer crowdfunding and lots of peer lending. It’s a risky portfolio, but a decent alternative IMO to just stocks. And I do have quite a bit of them, too.
Thanks for the comment Eelis.
Yes, I also wouldn’t be 100% in stocks, this post is more aimed towards people who are keeping larger amounts in cash or need the last push to start employing their money.
Btw, I actually saw that you own a camel a few days ago while reading your review of Agrikaab. 🙂
A very visual argument you are actually making!
I think we all totally underestimate the power of the stock market in the long term. At the same time we also underestimate the unused potential that sits in cash! Why do I say this: I am reviewing my asset allocation once a year, also to re-balance my portfolio. I notice that the cash component keeps being higher than I would have guessed. All of the surplus cash I find, I invest directly according to my asset allocation.
Yes, during rebalancing it takes care of itself. Another approach to stop the cash component getting higher, instead of asset allocation, is to set an amount that you want to keep in cash and always invest the surplus, not only during rebalancing. Simply never have allow to have more than X$ in cash by investing anything above X$.