
Core Portfolio for EU Investors (ETF Selection & Tips)
If you’re investing from Europe, you most probably spent a lot of time researching ETFs and determining your asset allocation.
And given the plethora of investment strategies and products you can choose from, it’s easy to get overwhelmed, especially as a beginner.
In this post, I’ll cover how a European investor’s core portfolio should look like. Using these tips will position your stock portfolio for best performance in the long run.
You might consider it a suggestion.
Core Portfolio Description
The MonkWealth-approved core portfolio has a few key characteristics:
- It contains exclusively low-cost funds (click here to read why)
- Is sufficiently diversified
- Consists of funds that reinvest the dividends (click here to read why)
- It’s not too complex to maintain
- Is market-cap weighted
- Leaves flexibility to be enriched/modified based on personal preferences
The two main regions that the core portfolio must cover are: US and EU.
The US Allocation
A United States ETF should be the largest allocation of this portfolio.
There is no alternative to this.
Avoid “North America” or “developed markets” ETFs that put multiple countries in one basket. Nothing should dilute the amount of money you put in the US markets.
The United States of America is the country that leads in terms of innovation, technological development, and productivity.
And all other countries follow. First the “developed nations” and then the rest of the world.
Economically as well: when the USA changes rates, the whole western world gets impacted. During US bull markets, all developed nations are thriving. When USA gets in a recession, we have a global economic downturn.
We live in the era of “American imperialism“. One must not ignore the influence the US has over the rest of the world.
Couple this with the fact that it’s the home of the most prosperous companies, and it becomes clear:
The US should be your major allocation.
Recommended United States ETF: CSPX (iShares Core S&P 500 UCITS ETF)
- Total expense ratio: 0.07%
- Distribution policy: Accumulating
- Index: S&P 500
Check my detailed reasoning behind why it’s the best pick in this post: CSPX vs IUSA vs VUSA.
The EU Allocation
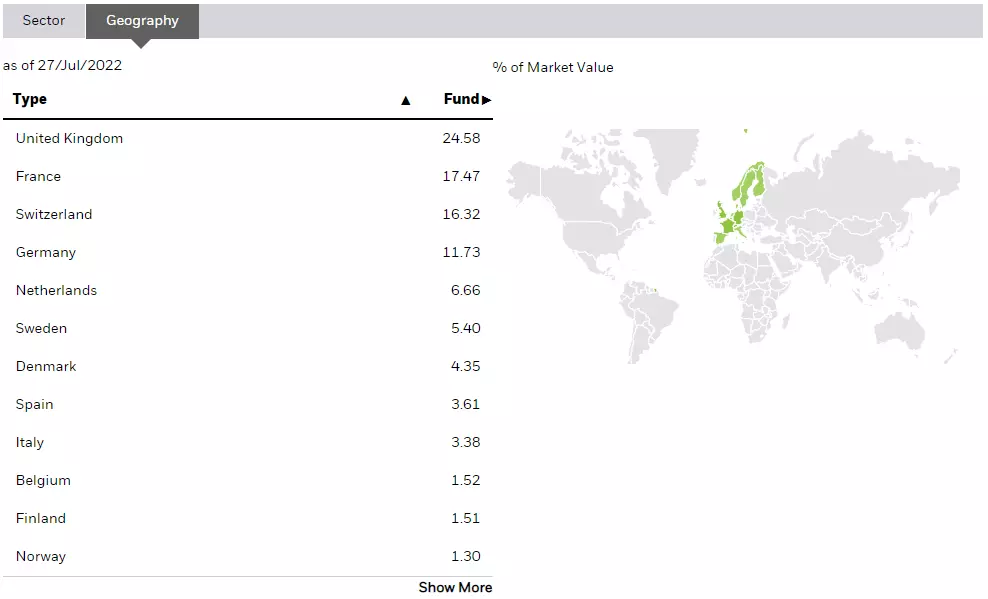
A developed Europe ETF is the smaller, but crucial part of the portfolio.
The reason that we’re not balancing these more equally is, first of all, because the EU market is smaller in market cap.
Also, one of the top European sectors is the Financial one. This is broken down into overregulated industries where innovation is (s)low. It will always reflect the economic progress, but won’t lead it.
EU is for the stability, not the growth. Given that none of these countries is becoming the technological-advancement hub of the world, this allocation smooths out the downside more than it boosts the upside.
At the same time, we eliminate too high of a concentration risk by adding diversification across more than 10 democratic countries with relatively stable economies.
Recommended Developed Europe ETF: IMEA (iShares Core MSCI Europe UCITS ETF)
- Total expense ratio: 0.12%
- Distribution policy: Accumulating
- Index: MSCI Europe
The Exact Numbers?
My theories aside, the numbers speak for themselves.
The current market-caps of the S&P 500 and the MSCI Europe constituents are around $36 trillion $9 trillion, respectively. If we apply simple market-cap weighing when taking this fact into consideration, it means that we need to distribute it 80/20.
I think this 80% USA allocation is sufficient, but should be considered the minimum due to reasons explained above.
Adjusting it to 85/15 or even 90/10 would be ideal.
And the added benefit? CSPX, same as most other S&P 500-tracking ETFs, has a TER of 0.07%. This will drastically lower your total cost, always in the 0.0x% range.
This allocation is MonkWealth approved and recommended. It’s your call if you choose to use it.
Beyond the Core Portfolio
As mentioned in the key characteristics, the core portfolio should leave flexibility for adding.
So, make sure that the core portfolio is at least 80% of your total allocation. This leaves you with 0-20% space to diversify into other markets as well.
Below are the my best optional recommendations:
Emerging Markets
Emerging markets are a great way to both increase diversification, but also to get exposure to a completely different region.
They’re especially valuable parts of a portfolio due to their less correlated nature with the rest of the core portfolio.
Still, I consider EM exposure as optional. But it’s my top recommendation beyond the core portfolio.
Eventually, we might see a sudden rise in the development of some of these nations. But historically, it consistently underperforms the developed markets. I’d be surprised to see a broad EM ETF having a continuous stellar performance. But that’s why this allocation boils down to preference.
In any case, I’d limit the exposure to a max of 10%.
Recommended Emerging Markets ETF: EMIM (iShares Core MSCI EM IMI UCITS ETF)
- Total expense ratio: 0.18%
- Distribution policy: Accumulating
- Index: MSCI Emerging Markets
Detailed reasoning behind why it’s the best Emerging Markets ETF: The Best Emerging Market ETF for Europeans
What About Canada, Australia, or Japan?
If you have reasons to want exposure to Canada or Australia, go for it.
If your only reasoning is diversification, my argument would be that the core portfolio already gives you sufficient diversification across the developed world. Leaving out 2-3 (non-crucial) countries won’t make the performance of the total portfolio much different. After all, they’re highly correlated with US/EU, which you already have plenty of.
Also, I can’t think of a scenario where any of those countries outperforms the US markets on a continuous basis.
Japan is different, as it’s less correlated with what you already hold. So exposure to Japan, or developed Asia in general, is MonkWealth approved.
Worth mentioning that Japan’s market’s performance has been terrible in the past 30 years, but that’s not an indicator for future returns.
Keep it up to 5% of the full allocation.
Recommended Japan ETF: SJPA (iShares MSCI Japan ETF)
- Total expense ratio: 0.15%
- Distribution policy: Accumulating
- Index: MSCI Japan
Sector Exposure
Boosting a certain sector is optional, discouraged without strong basis, but MonkWealth approved.
The ETF you’re using to boost a sector would contain an overlap of companies that you already invest in. In this case, this is fine. Your goal is to strengthen your allocation in these companies.
To remain a “passive”, “broad-market”, “index” investor, I’d limit the allocation to 5-10% of the total portfolio. More than that might make you cross the line between index investing and stock picking.
I won’t give examples of ETFs because there are plenty of sectors that different investors might want to boost.
Example Portfolios
The Classic Core Portfolio
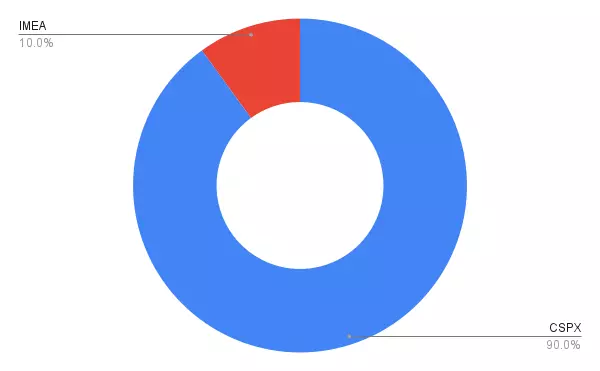
- CSPX (iShares Core S&P 500 UCITS ETF): 90%
- IMEA (iShares Core MSCI Europe UCITS): 10%
Note: the total expense ratio of this amazing portfolio is 0.075%. IWDA is almost 3 times more expensive, for a similar performance and diminishing returns on diversification.
Keep in mind: this is just an example. If you feel that a 90/10 is too concentrated, you can change it to 80/20 or anything in between (85/15 etc.).
The US/EU/EM Portfolio
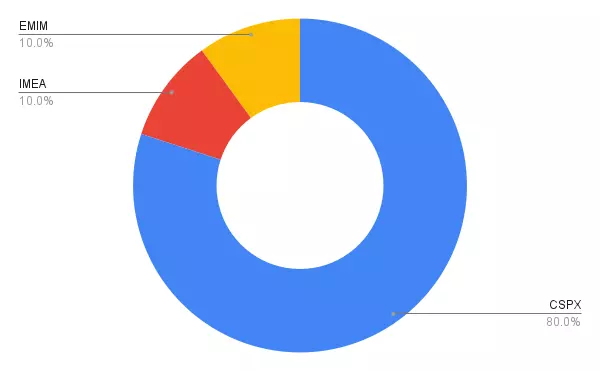
- CSPX (iShares Core S&P 500 UCITS ETF): 80%
- IMEA (iShares Core MSCI Europe UCITS): 10%
- EMIM (iShares Core MSCI EM IMI UCITS ETF): 10%
Again, this is just an example with round numbers. Distributions of 85/7.5/7.5 or 85/10/5 are also good alternatives.
It depends on what you want.
The Core Portfolio with EM and Tech Boost
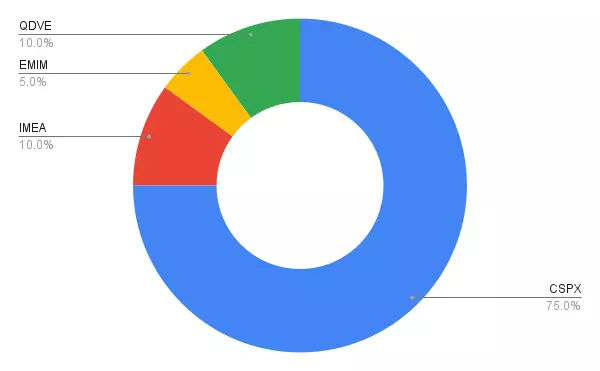
- CSPX (iShares Core S&P 500 UCITS ETF): 75%
- IMEA (iShares Core MSCI Europe UCITS): 10%
- EMIM (iShares Core MSCI EM IMI UCITS ETF): 5%
- QDVE (iShares S&P 500 Information Technology Sector UCITS ETF): 10%
Won’t list alternative allocations as there can be much variation, but you get the point.
You can decrease the sector boost in accordance with the strength of your conviction. The more the personal twist you put, the less “index investing” you’re doing.
A Combination of All Mentioned ETFs
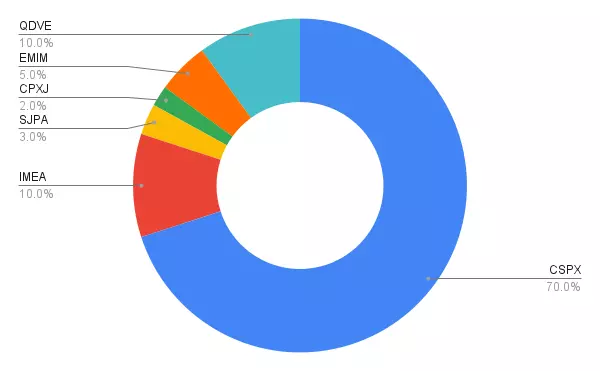
- CSPX (iShares Core S&P 500 UCITS ETF): 70%
- IMEA (iShares Core MSCI Europe UCITS): 10%
- SJPA (iShares MSCI Japan ETF): 3%
- CPXJ (iShares Core MSCI Pacific ex Japan UCITS ETF): 2%
- EMIM (iShares Core MSCI EM IMI UCITS ETF): 5%
- QDVE (iShares S&P 500 Information Technology Sector UCITS ETF): 10%
I won’t list the alternative because there can be endless variation.
Also, keep in mind that a 6 (or more) ETF portfolio increases the rebalancing complexity. At this stage, it’s worth asking oneself whether Asia Pacifix ex-Japan and a sector boost is really something they want.
Closing Thoughts
Whatever you’re doing, a combination of CSPX and IMEA should be at least 80% of your long-term stock portfolio. Even leaving it at 100% is not a mistake.
This will optimize your portfolio’s long-term performance, especially compared to the alternatives. This is mainly due to the fact that the total-portfolio total expense ratio will always be in the format of 0.0x%.
But, of course, I fully support everyone’s freedom of choice to spend 0.22% on VWCE.
With all that being said, if you feel like this post is a bit too advanced for your level, you can start here: Learn to Invest Series
In case you want a one-stop-shop for everything you need to get started, I also have a book: Become an Investor
Invest wisely!






No Comments