
Supply and Demand – An Introduction
The law of supply and demand is something that’s often referenced, but rarely explained.
And most people without formal education in economics, although they can understand how it affected certain situations in the past, can’t really apply the same laws to understand current events or forecast the future.
Anyway, this post won’t make you psychic.
However, it can serve as a solid foundation in case you have a general idea about the results of buying and selling pressure, but not a full understanding of why it works that way.
This will be a gentle introduction. We won’t calculate specific numbers nor analyze complex cases.
The goal of the post is to cover the basics for people who didn’t have economic background or education. It will also serve a purpose as further reading each time we reference the laws of supply and demand.
With that said, let’s understand the supply and demand curves first.
Demand Curve
Demand refers to the quantity of a good that consumers are both willing and able to buy at various prices.
The demand of goods is not only a function of that good’s price, but other factors as well. These include: income, price of substitute goods, and price of complementary goods.
For example, an individual’s demand for a brand new phone case will be a function of its price, the person’s income, the price of the alternative cases (substitute goods), and the price of the mobile phones (complementary goods).
Let’s analyze the relationships between each.
- The quantity demanded increases as the substitute goods’ prices increase. Which makes sense, as if the substitute products have lower prices, a consumer has no reason to buy the most expensive one. For example, if you live in the vicinity of two stores, both offering the same service for a different price, you’d always go for the cheaper option.
- On the other hand, the quantity demanded increases as the complementary goods’ prices decrease. If the price for all phones skyrocket, you wouldn’t be able to afford a phone and thus your demand for the new phone case will decrease.
- The quantity demanded increases as the income of the consumer increases, as he can afford a higher quantity of the good.
- And lastly, the demand increases as the price of a good decreases. This is what we’re interested in.
If we assume values for income and the prices for related goods, we’ll be left with the relationship between the good’s price and quantity demanded.
This is called the demand curve and is illustrated in the picture below.
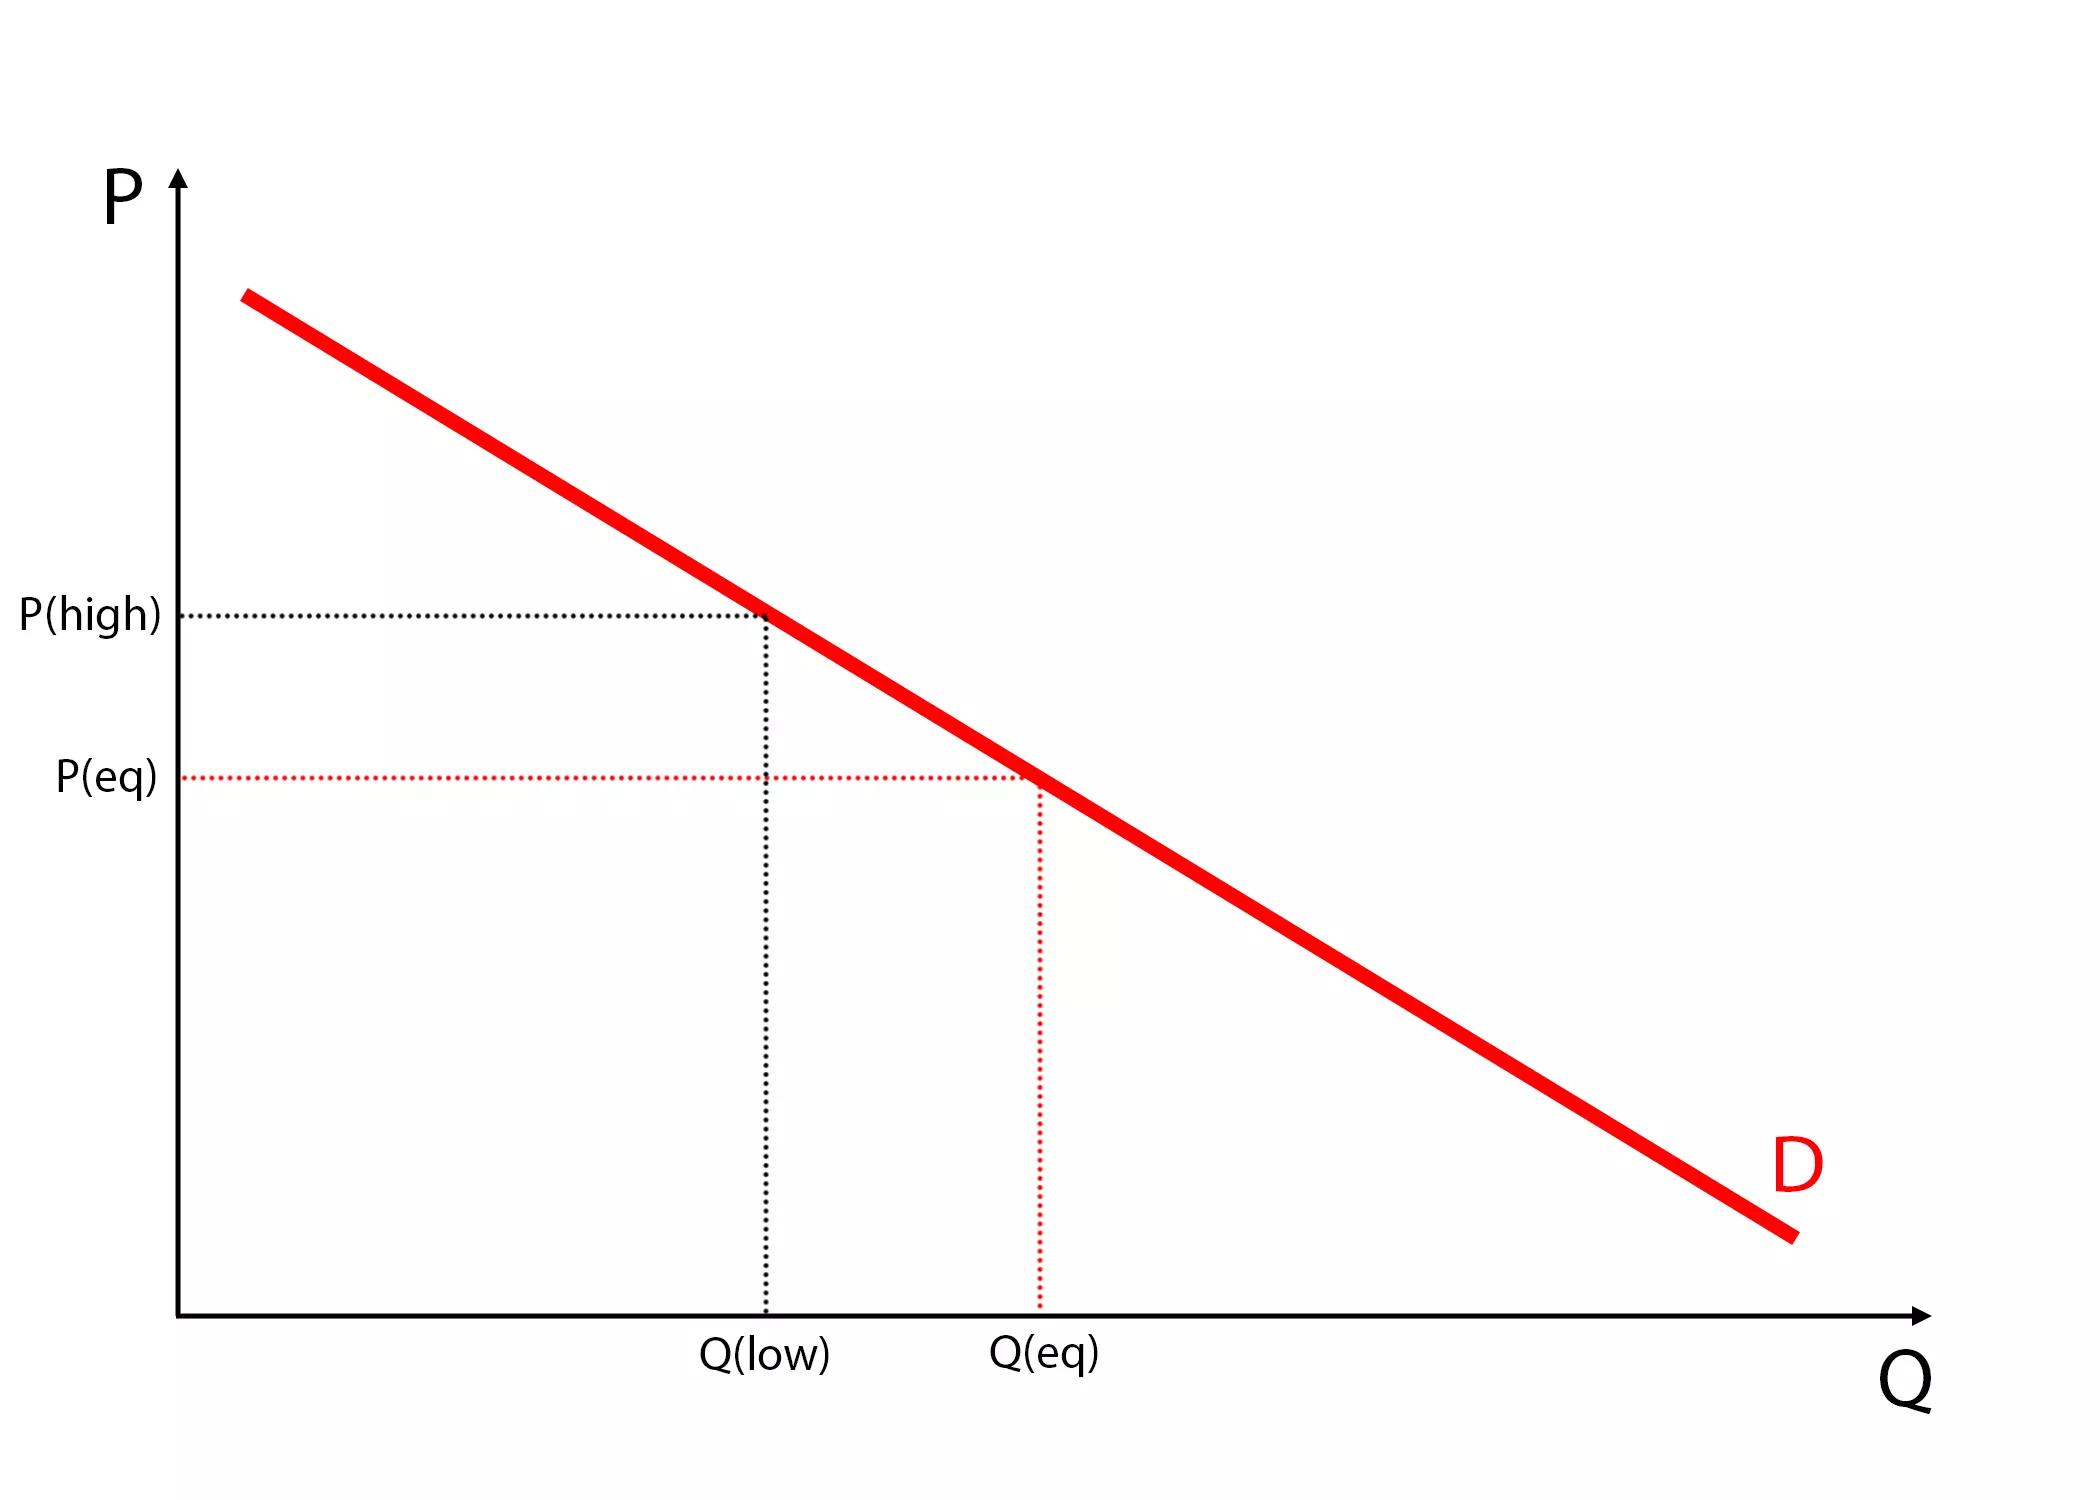
The fact that the demand is higher at lower prices is referred to as the law of demand.
Note how a change in price to P(high) changes the quantity demanded to Q(low) in response.
In other words: as prices increase the demand decreases and as prices decrease the demand increases.
Supply Curve
Supply refers to the quantity of a good that producers are both willing and able to sell at various prices.
The supply of a good is also not a function of the selling price only, but of the costs of production and selling as well.
For example, a manufacturer’s supply of phone cases will be a function of its selling price, but also the salaries payable (cost of labor), price of the materials needed, cost of machinery, etc.
Similar as we described above, the supply for a good decreases with increasing costs of production (if your wage expense is too high or the raw materials increase in price, selling a product may not be worth it anymore) and increases with its selling price (as suppliers would always chase a greater margin).
If we assume values for all production costs, we’ll be left with the relationship between the good’s price and quantity supplied.
This is called the supply curve and is illustrated in the picture below.

The fact that the supply is higher at higher prices is referred to as the law of supply.
Note how a change in price P(high) changes the quantity demanded to Q(high) in response.
In other words: as prices increase the supply increases and as prices decrease the supply decreases.
Equilibrium price and equilibrium quantity
To get the equilibrium price and quantity for a good, we use the market supply and demand functions and solve for the price for which the quantity demanded equals the quantity supplied.
Graphically, the equilibrium price and quantity are at the point where the demand and supply curves intersect. This is illustrated below.
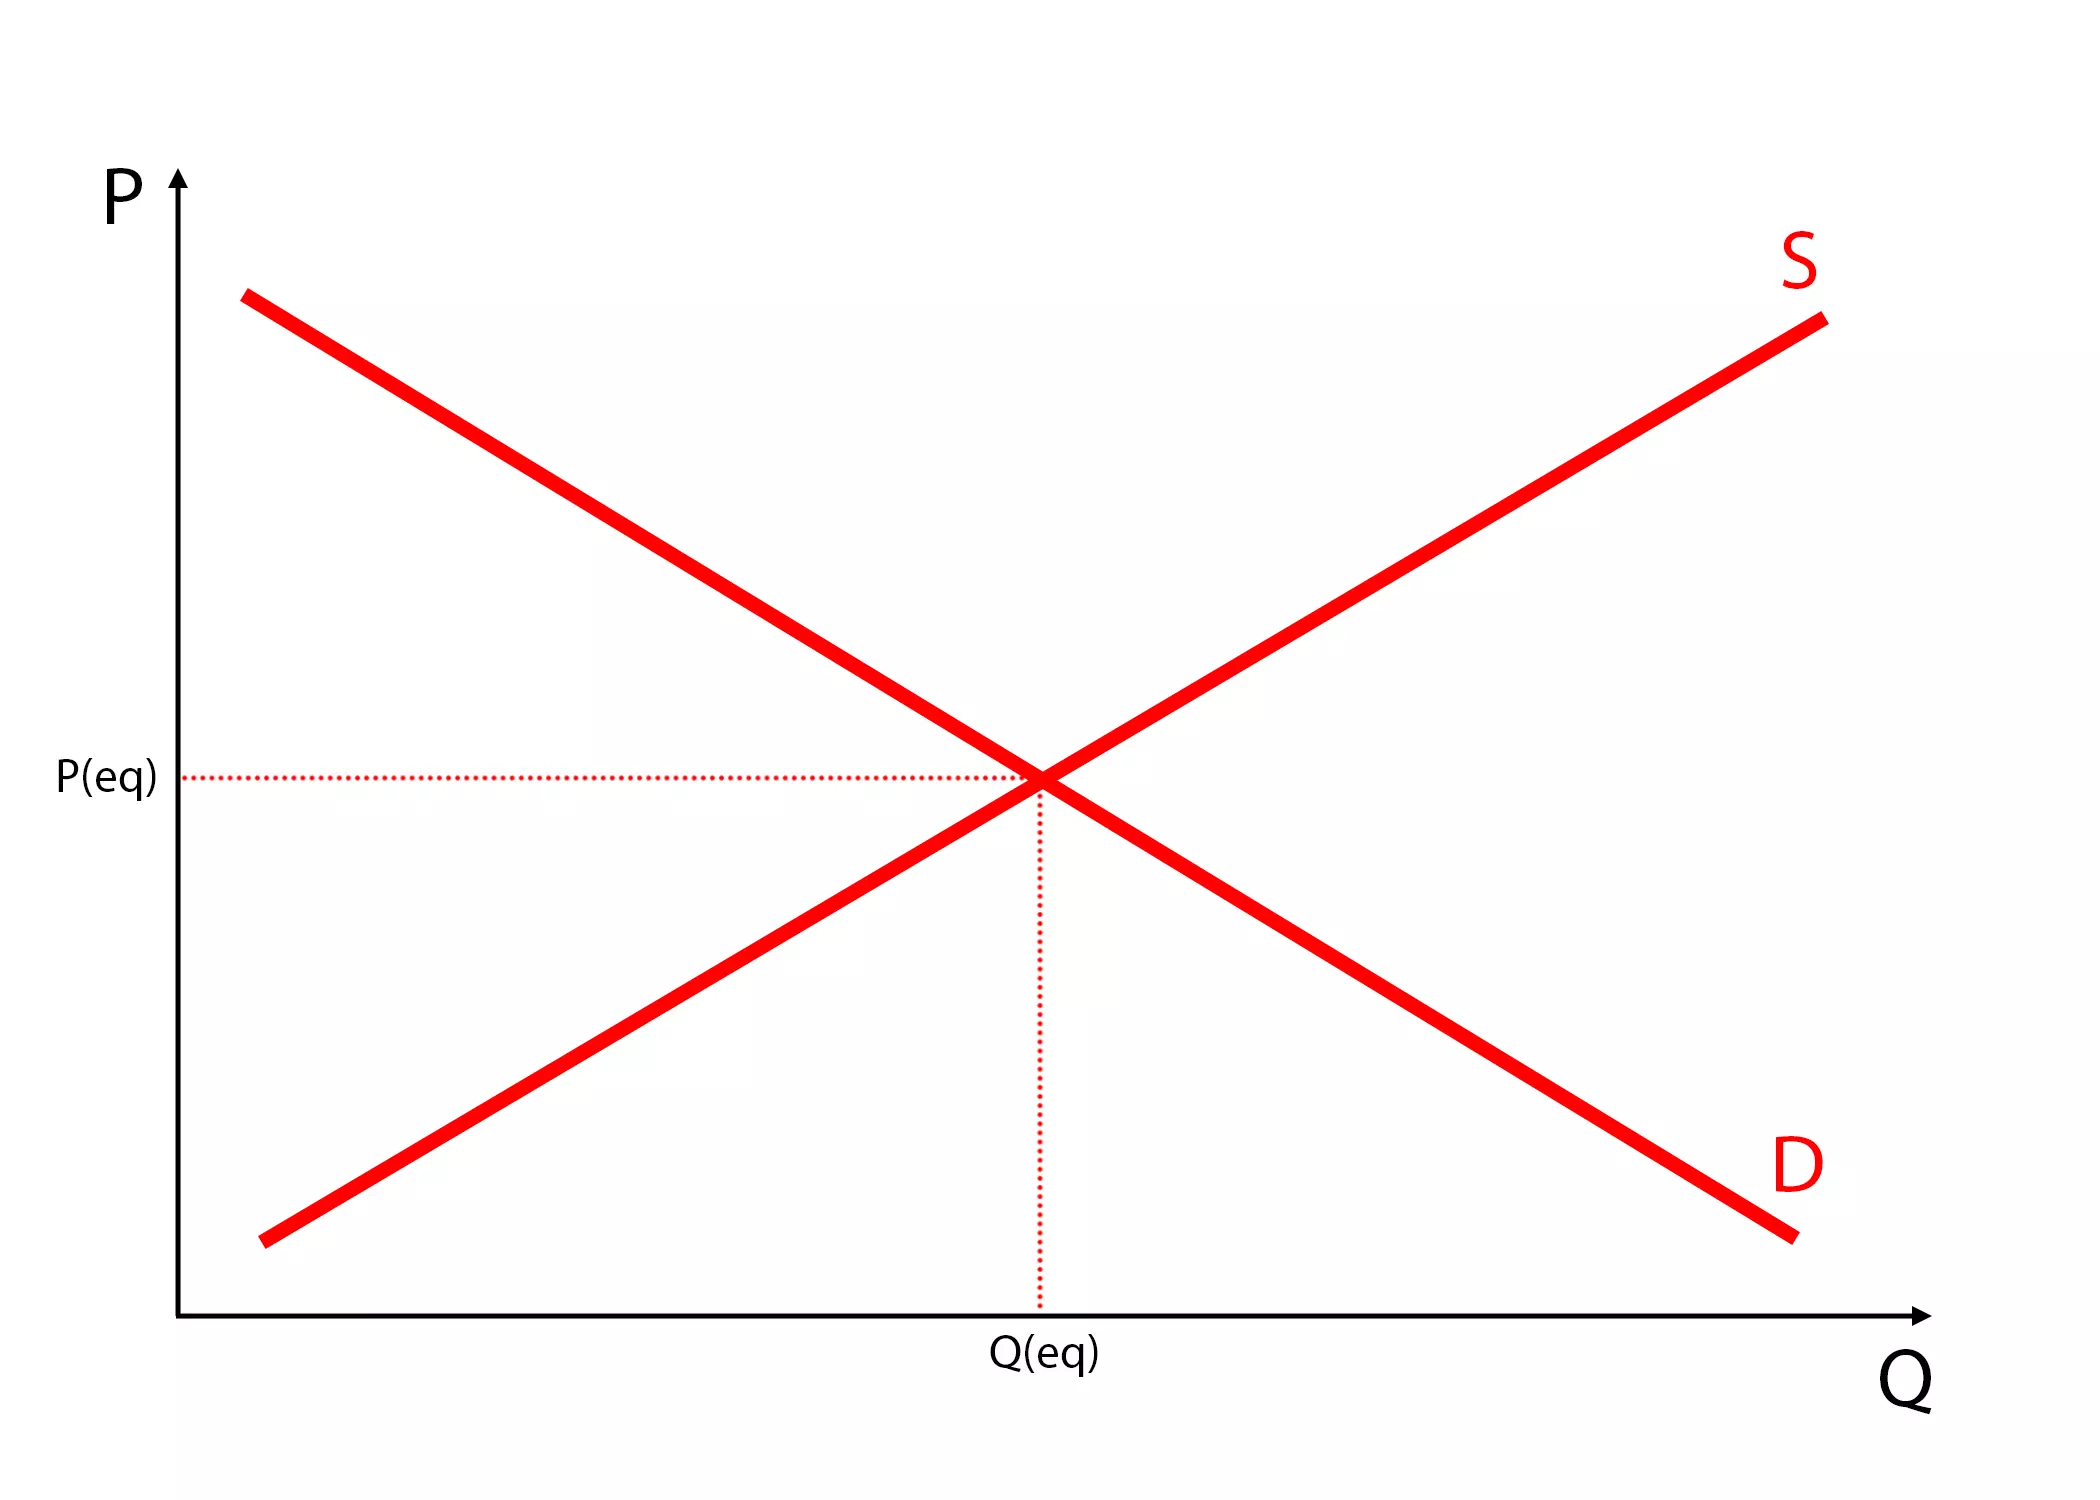
Any deviation will be pushed back to the equilibrium by the market forces.
For example, if some suppliers push the prices down by selling at a lower price, other suppliers will reduce production in response to lower price (creating lack of supply). At the same time, due to the (temporarily) lowered prices, the demand for the good will increase (creating excess demand), making the consumers compete for the limited supply and thus willing to pay more, ultimately resulting in increasing the price back to the equilibrium price.
Same goes for prices pushed above the equilibrium price: if suppliers start selling a good at a higher price, more suplliers will join the gold rush, sorry, the market (creating excess supply). Due to the rising prices, less people will be interested to buy the supplied good (creating lack of demand), which will ultimately result in a price decrease back to the equilibrium.
These activities are observable both from micro and macro-economic perspective. Can you think of certain cases where you recognized it?
So can an equilibrium price ever change?
Yes, but not solely by manipulating prices.
These are called shifts in the market curves and are caused by increases in demand and/or supply due to changes in income levels and prices of substitute and complementary goods (for demand) or prices and availability of input goods, advancements of technology, etc. (for supply).
Or the complete set would be described as: shifts in the supply and demand curves occur because of changes in any relevant factor that’s not the price.
If you’re a student remember this: Price changes are movements along the curves, while changes in other factors are shifts of the curves.
Market and aggregate supply and demand
I’ll just scratch the surface here in order to cover some more terminology.
Market demand and market supply refer to the sum of quantity demanded or supplied for a good or service at each price across all consumers in the market.
Aggregate demand and aggregate supply refer to the total demand by all consumers or total supply by all suppliers for all goods and services at each price across all markets in an economy.
Afterword
I hope you understand the law of supply and demand a bit better now. However, I think there is one question in most returning readers’ minds at this moment:
Why?
Why did I write this post out of the blue without any relation to the common topics I cover (such as personal finance, investing, or financial independence)?
But its relevance is huge. Similarly as the inflation post, this will be one of the most referenced posts going forward.
I wanted to dedicate a full post where I cover the basics, as I have many things I wrote or like to write about that are based on these laws. And instead of describing the concept each time, I want to have a series to reference.
Did I say a series?
Yes, I did. This is a first part of a three part series on supply and demand. Expect the remaining ones really soon!
Meanwhile, if you found value in this post, I’d appreciate a share on social media and a subscription below so you don’t miss the rest of the posts.


Comments: 1
[…] Supply and Demand – An Introduction […]